Since last week, I’ve worked on a side project for Robert, my former advisor and good friend. He told me that Matlab has a function called eigshow, which creates a GUI to help us “see” singular value decomposition and eigenvalue decomposition. He wanted a GUI that would similarly help us see and understand induced matrix norm.
The GUI that eigshow creates is cool but rudimentary. What really bothers me is how poorly the code was maintained, with no documentation. I could follow it after some time, but I decided it would be better if I write my GUI from scratch.
So far, my GUI helps you visualize three things:
- Matrix norm
- Singular value decomposition
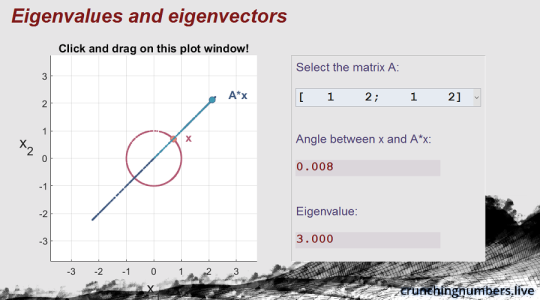
- Eigenvalue decomposition
The GUI feels great if you have touchscreen and move the vectors with your finger instead of a mouse. I’m hoping to add more features (my code are very modular!) before I get to present linear algebra here. We’ll definitely go over some of the GUI aspects then. Until then, please enjoy these screenshots that I made.
You can find the code in its entirety here:
Download from GitHub


 . Sparse means there are many entries that are zero, and compressive sensing considers this fact to find a unique solution to an

 and
and  . They are quantities of length, so they take on a nonnegative value. Let’s try out some values and see what these parameters do. I have colored the resulting shapes in red. (Note, the scales are different.)
 (move along the diagonal, starting from bottom-left), we get the shape of a nice heart. When we increase
  ?
?
You must be logged in to post a comment.